17 minute read
GR00T N1.7, 24.6% faster on H100 with Fenon.
Engineering notes on running NVIDIA’s GR00T N1.7 in 16.1 ms per action chunk on H100, against 21.3 ms with NVIDIA’s TensorRT path.
GR00T N1.7 is NVIDIA’s open foundation model for robot manipulation. Each call takes camera images, the robot’s state and a language instruction, and returns a chunk of actions. While that call runs, the robot keeps acting on the previous observation, so inference latency directly affects control.
We ran the same GR00T N1.7 checkpoint on the Fenon runtime and on NVIDIA’s optimized TensorRT deployment, on the same GPUs with the same inputs. On H100 the weights, numerical precision and four denoising steps were unchanged. The Fenon runtime returned actions 24.6% faster on H100 and 42.8% faster on A100. This post covers how we measured that, what we changed, and which quantization experiments failed.
- Lower median latency than NVIDIA TensorRT on H100
- 24.6%
- Speedup on H100, p95 down from 21.64 to 16.33 ms
- 1.33×
- Lower median latency on A100, 1.75× the calls per second
- 42.8%
- Gripper decisions changed; worst action error +0.36%
- 0
Results.
The baseline is NVIDIA’s optimized full-pipeline TensorRT path, built from NVIDIA’s code and run on our machine. We timed 180 complete calls per runtime, from raw camera frames to decoded actions, alternating between the runtimes across three processes.
H100 · GR00T N1.7 LIBERO
A100 · GR00T N1.7-3B DROID
| Metric | NVIDIA TensorRT | Fenon runtime | Change |
|---|---|---|---|
| H100 median | 21.34 ms | 16.08 ms | −24.6% |
| H100 p95 | 21.64 ms | 16.33 ms | −24.5% |
| H100 speedup | 1.00× | 1.33× | |
| A100 median | 68.48 ms | 39.18 ms | −42.8% |
| A100 p95 | 70.55 ms | 41.60 ms | −41.0% |
| A100 throughput | 14.6 calls/s | 25.5 calls/s | 1.75× |
On both GPUs the p95 fell by about as much as the median: 24.5% on H100 and 41.0% on A100. NVIDIA publishes 22.9 ms for its TensorRT path on H100 for this workload, but the input behind that number isn’t public, so we compare against NVIDIA’s code on our own machine.
Benchmark inputs.
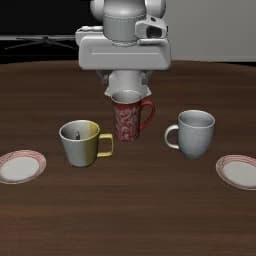
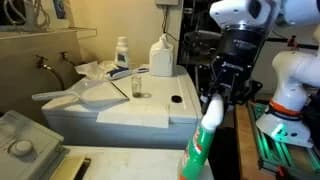
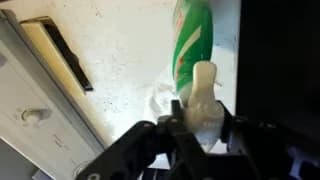
These are the frames the policy received: a simulated LIBERO tabletop for the H100 runs and a real DROID lab scene for the A100 runs. Every timed call gets fresh images, state and noise. Nothing is cached between calls.

Output quality.
We fixed the quality checks before timing anything and ran them on LIBERO and DROID observations that weren’t used for timing. Compared with NVIDIA’s output, actions had to keep a cosine similarity above 0.999, no action dimension could degrade by more than 1% against the recorded demonstrations, and no gripper open/close decision could change.
| Quality check | Gate | H100 | A100 |
|---|---|---|---|
| Minimum action cosine similarity | > 0.999 | 0.9999968 | 0.99966 |
| Worst action-group error change | < 1% | +0.36% | +0.13% |
| Gripper decision flips | 0 | 0 | Not measured |
On H100 the largest change in any action dimension was 0.36%, and 1,000 consecutive calls gave finite outputs with exact repeats for the same seed. On A100 the vision encoder runs in FP16, which shifts the actions slightly; the largest change was 0.13%.
Where the time went.
Before changing anything we profiled NVIDIA’s path with Nsight Systems. On A100, the GPU was idle for the first 12.2 ms of each call while the CPU prepared images, and for the last 11.2 ms while the CPU decoded actions.
On H100, at least one kernel was running for 13.2 ms of a 22.7 ms profiled call. For the other 9.5 ms the GPU was waiting: on the CPU, on a synchronization after every engine, and on tensor shapes being copied back to the CPU mid-call.
We therefore worked in this order: eliminate idle time, eliminate repeated work, then optimize the computation itself or reduce its precision.
Eliminating idle time.
Stages run back to back. NVIDIA’s wrapper synchronized with the CPU after every engine. We queue the vision, language and action stages on one CUDA stream, track each input’s lifetime, and wait only once, when the actions come back.
One kernel for input preparation. Embedding lookup, visual-token scatter, position IDs and attention masks previously required a series of small kernel launches and CPU round trips. We wrote one Triton kernel that does all of it and checked it for exact equality on 170 cases, including 97 real observations. Together, these first two changes took latency from 21.06 to 18.93 ms, and all 280 decoded action arrays still matched NVIDIA’s bit for bit.
Fixed shapes and CUDA graphs. The language engine contained three operations whose output size depends on the data, which forced 32 synchronous copies back to the CPU per call and made graph capture impossible. We rewrote that step as a fixed-size gather that produces the same values, verified on 144 real cases. With fixed shapes, the vision and language engines replay as CUDA graphs: 16.90 ms, still identical.
Masks built once per call. The action model rebuilt the same attention masks on each of its four denoising passes. We build them once per request inside the action graph. Kernel launches in the action model fell from 1,425 to 1,332 per call.
Caching CPU work. Device lookups, prompt templating and tokenization now happen once or come from a small bounded cache; images, state, noise and actions never do. One early version of the cache key checked the tokenizer’s size on every call and pushed latency to 38.1 ms. That check cost more than the tokenization it protected. We now read the size once and clear the cache if tokens are added.
- Fenon runtime
- NVIDIA TensorRT
Custom kernels.
After the waiting was gone, the action model was the largest cost: about 8 ms of kernel time per call. Its biggest single operation is the feed-forward down-projection, a 41 × 6144 activation times a 6144 × 1536 weight, repeated across 32 layers and four denoising passes. We wrote our own kernels for it.
We built and measured 62 of them on the real checkpoint weights, with a working set larger than the GPU’s L2 cache: 16 direct tilings, 32 split-K variants, 8 that use Hopper’s TMA hardware and 6 Stream-K partitions.
The best split-K kernel ran at 12.68 µs per layer against the library’s 12.0 µs. Hopper-specific instructions didn’t change that: we confirmed TMA and WGMMA in the compiled code, and a hot-cache advantage disappeared once the full 604 MB working set was in use. The sweep did show that TensorRT wasn’t using the library’s fastest path for those 32 layers. Routing them to it took the full policy from 16.60 to 16.04 ms in the same test run.
Quantization, layer by layer.
Hopper has native FP8 tensor cores, so lower precision was the natural next step. We tested it one component at a time, then one transformer block at a time, and built every promising candidate as a real FP8 TensorRT engine.
FP16 and FP8 versions of the vision encoder, the language model and the action model were all faster, and all failed the quality checks. We then quantized one transformer block at a time in simulation, across 48 calibration observations, to find blocks that could be quantized on their own.
Action model · 32 blocks · 8 of 32 pass
- 0
- 1
- 2
- 3
- 4
- 5
- 6
- 7
- 8
- 9
- 10
- 11
- 12
- 13
- 14
- 15
- 16
- 17
- 18
- 19
- 20
- 21
- 22
- 23
- 24
- 25
- 26
- 27
- 28
- 29
- 30
- 31
Language model · 16 blocks · 0 of 16 pass
- 0
- 1
- 2
- 3
- 4
- 5
- 6
- 7
- 8
- 9
- 10
- 11
- 12
- 13
- 14
- 15
Simulation didn’t predict the real engines. Blocks 4, 5, 16 and 31 passed together in simulation but degraded one action dimension by 1.88% as a real engine. Block 13 alone degraded gripper error by 3.85%. TensorRT’s engine inspector confirmed that native FP8 E4M3 kernels were running, so the builds were correct.
| Real FP8 engine | Early check | Real engine result | Verdict |
|---|---|---|---|
| Action blocks 4, 5, 16, 31 | Passed simulation | y error +1.88% | Rejected |
| Action block 13 | Passed simulation | gripper error +3.85% | Rejected |
| Action block 4 | Passed simulation | y error +1.49% | Rejected |
| Action block 16 | Passed simulation | gripper error +3.85% | Rejected |
| All 32 action blocks | Not run | gripper error +69.2% | Rejected |
| Vision feed-forward layers | Passed 8 observations | 1 gripper flip in 40 observations | Rejected |
| A100: 48 vision layers in INT8 | Calibrated on 16 observations | cosine 0.966 at 37.5 ms | Rejected |
We then quantized weights and activations separately. Weights-only failed in both blocks we tested, with gripper error degraded by 4%. Activations-only passed for block 4 and failed for block 16. This suggests the per-tensor scaling we used is too coarse. Blackwell’s MXFP8 and NVFP4 formats scale smaller blocks of values, and we’ll test them next.
Rejected approaches.
We also tried making the model do less work, with lower precision or fewer denoising steps. Every version was faster than NVIDIA’s path, and every version failed the quality checks. The latency gains were also modest. FP8 in four action blocks saved 0.28 ms over the unquantized runtime it was built on, and block 13 alone saved 0.01 ms. FP8 in all 32 action blocks saved 1.89 ms. Only fewer denoising steps saved more than 2 ms, and they degraded action quality severely.
Fewer denoising steps. Two steps brought latency to 13.0 ms on H100 and one step to 10.8 ms, but gripper error went up by more than 1,500% and 9,000%. The model was trained with four steps.
FP16 vision. FP16 vision kept cosine similarity at 0.99994 but degraded one action dimension by 6.1%. A cosine check alone would have passed it.
Results differ by GPU. FP16 vision passed on A100 and failed on H100 with the same DROID workload, degrading gripper error by 1.4%. We run the checks on each GPU separately.
Because one similarity score can hide a large error in a single dimension, we check every action dimension and every gripper decision before keeping a change.
A100.
On A100 we used a heavier workload: the base N1.7-3B checkpoint on a real DROID observation, two cameras with two frames each, 461 vision-language tokens. The approach was the same: remove the waiting, move image processing to the GPU, then use the lowest precision that passes the checks.
- Fenon runtime
- NVIDIA TensorRT
The final A100 runtime measured 39.18 ms against 68.48 ms, 42.8% lower, and each of the three process pairs was more than 40% lower. Across 39 additional observations, the minimum cosine similarity was 0.99966 and the largest change in any action dimension was 0.13%.
Remaining latency.
In the Fenon runtime on H100, the action model is the largest remaining cost, at 7.86 ms of kernel time across 1,332 kernels per call. The vision encoder takes 3.19 ms and the language model 1.71 ms. About 4.7 ms per call has no kernel running. Some of that is required input processing and the final copy, so it can’t all be removed.
In traces, the final copy of actions to the CPU appears as an 8 ms memcpy. The transfer is 21,120 bytes and takes about 2 µs; the rest is the CPU waiting for the action model to finish.
How we measured.
Both runtimes ran on the same machine, with the same checkpoint and inputs, in alternating processes.
| Setup | H100 | A100 |
|---|---|---|
| GPU | H100 80 GB HBM3 | A100-SXM4 40 GB |
| Model | GR00T N1.7-LIBERO (libero_10) | GR00T N1.7-3B |
| Input | LIBERO, two 256×256 cameras | DROID, two cameras × two frames |
| Vision-language tokens | 156 | 461 |
| Denoising steps | 4 | 4 |
| Action horizon | 40 (16 decoded actions) | 40 |
| Baseline | NVIDIA optimized TensorRT | NVIDIA optimized TensorRT |
| Fenon precision | Unchanged (FP32 vision, BF16 language and action) | FP16 vision, BF16 language and action |
| Software | PyTorch 2.9.0, TensorRT 10.15.1.29 | PyTorch 2.9.0, TensorRT 10.15.1.29 |
| Calls per runtime | 180 (3 processes × 60, 20 warmups each) | 180 (3 processes × 60, 20 warmups each) |
| Dates | 18–19 October 2026 | 18–19 October 2026 |
Latency is one complete, warmed, local call, from raw observation to decoded actions. Startup, network and queueing are excluded. Quality checks are offline; closed-loop task success has not been measured yet.
Next steps.
B300. We will run the same comparison on NVIDIA B300, including block-scaled FP8 for the action model.
More tasks. We will evaluate both runtimes side by side on closed-loop pick-and-place tasks and report task success alongside latency.
Live API. We will make GR00T N1.7 on Fenon available through a hosted API designed as a drop-in replacement for existing inference endpoints, with the same inputs and action outputs. Reported latency will include network and queueing.
More models. We will extend the runtime to other robot foundation models.